

If you want to improve your website traffic through SEO, the Performance Report in Google Search Console (GSC) is one of the most important tools you should learn. It helps you understand how your website appears in Google Search, which keywords are bringing traffic, which pages are performing well, and where you need improvement.
Whether you are a blogger, business owner, student, or digital marketer, this report gives valuable SEO insights directly from Google. According to Google, the Performance report helps website owners track clicks, impressions, CTR, and average position in search results.
What is the Performance Report in Google Search Console?
The Performance Report shows how your website performs on Google Search. It provides data about:
- Total Clicks
- Total Impressions
- Average CTR (Click Through Rate)
- Average Position
It also shows:
- Which keywords users searched
- Which pages are getting traffic
- Traffic by country
- Device-wise performance
- Search appearance data
This report is extremely useful for SEO analysis and content optimization.
How to Open the Performance Report
Follow these simple steps:
- Login to Google Search Console
- Select your website property
- From the left sidebar, click Performance
- Open Search Results
You will now see your website’s search performance dashboard.
Understanding the Main Metrics
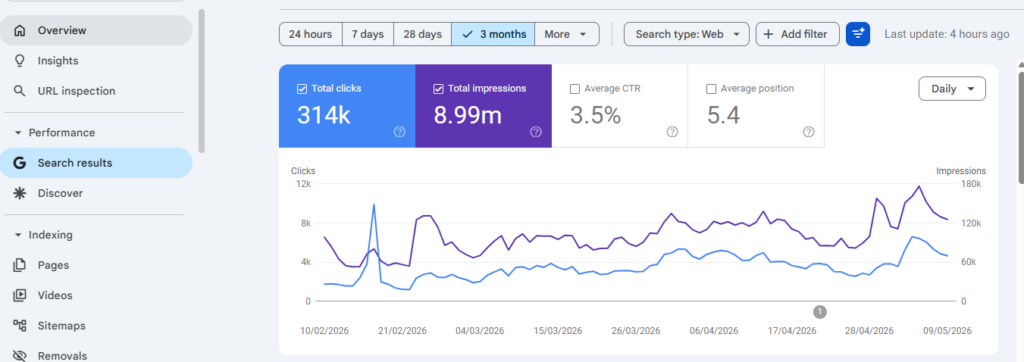
This dashboard gives you a complete overview of how your website is performing on Google Search. Here, you can track important metrics like total clicks, impressions, average CTR (Click-Through Rate), and average search position. These insights help you understand how users are finding your website, which pages are performing well, and where improvements can help increase your search visibility and traffic.
1. Total Clicks
This metric shows the total number of times users clicked on your website link from Google Search results. It helps you understand how much traffic your website is receiving through organic search.
Example: If 500 users clicked on your blog or website from Google Search, your Total Clicks count will be 500.
2. Total Impressions
Impressions mean how many times your website appeared in search results, even if users did not click.
A high impression count means Google is showing your content frequently.
3. Average CTR
CTR stands for Click Through Rate.
It is calculated using:
CTR=Impressions Clicks×100
If your CTR is low, you may need to improve:
- SEO titles
- Meta descriptions
- Content relevance
Google mentions that CTR helps identify pages where users see your result but do not click on it.
4. Average Position
This shows your average ranking position on Google Search.
Example: If your page appears mostly at position 5, your average position will be near 5.
Lower numbers are better because they indicate higher rankings.
How to Analyze Keywords in Performance Report
Go to the Queries tab.
Here you can see:
- Search keywords
- Clicks from each keyword
- Impressions
- CTR
- Ranking position
What You Should Look For
High Impressions + Low CTR
This means your website pages are appearing in Google Search results frequently, but users are not clicking on them. It usually indicates that your content is visible but not attractive or relevant enough to encourage clicks.
To Improve CTR:
- Write more engaging and clear blog titles
- Optimize your meta descriptions with relevant keywords
- Make sure your content matches the user’s search intent
- Use numbers, questions, or power words in titles to attract attention
- Ensure your page content delivers what the search result promises
Keywords Ranking on Position 8–20
These are easy SEO opportunities.
Updating content, adding FAQs, improving internal linking, and optimizing headings can help move them to Page 1.
How to Analyze Pages
Open the Pages tab.
This helps identify:
- Top-performing pages
- Low-performing pages
- Pages with declining traffic
You can compare pages and identify which blog posts need updates.
Google officially recommends using page-level analysis to identify high CTR and low CTR pages for optimization.
Device Analysis
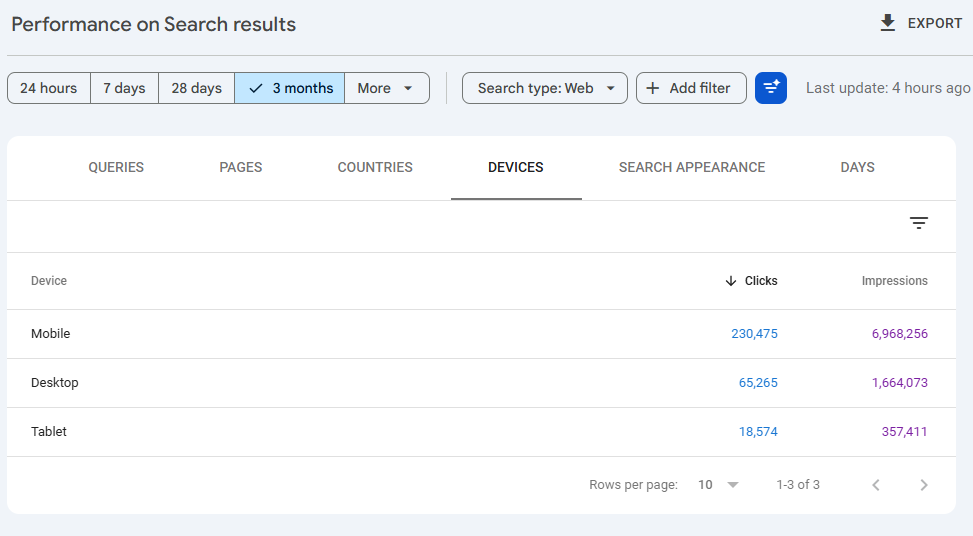
Click on + New → Device.
You can compare:
- Mobile
- Desktop
- Tablet
This helps you understand where users are coming from.
If mobile CTR is low, improve:
- Mobile page speed
- Mobile design
- Readability
Country-Based Traffic Analysis
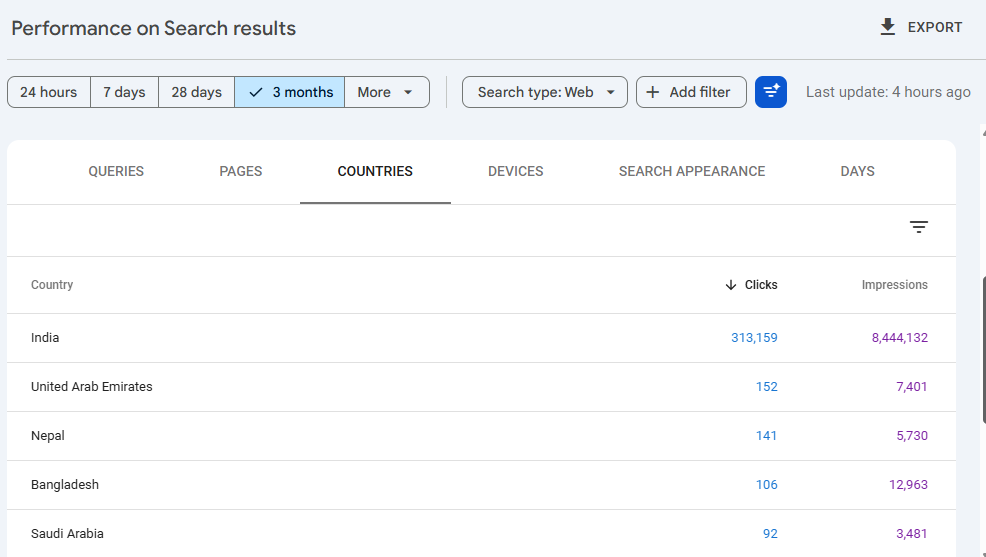
Using the Country filter, you can see which countries generate traffic.
This is useful for:
- International SEO
- Language targeting
- Local SEO campaigns
Date Comparison Feature
One of the best features in the Performance Report is date comparison.
You can compare:
- Last 28 days vs previous 28 days
- Month-over-month traffic
- Year-over-year SEO growth
This helps track the impact of:
- SEO updates
- New blog posts
- Google algorithm changes
Google has also introduced weekly and monthly data views for better long-term trend analysis.
Using Filters in Performance Report
Filters help you analyze specific data.
You can filter by:
- Query
- Page
- Country
- Device
- Search appearance
Example:
You can check performance only for blog pages using URL filters.
Google also supports regex filters for advanced keyword analysis.
Common SEO Uses of Performance Report
Find Low-Hanging SEO Opportunities
Look for:
- High impression keywords
- Rankings between 5–20
Optimize these pages first.
Improve Existing Blog Posts
Use keyword data to:
- Add missing topics
- Improve headings
- Update content depth
Discover New Content Ideas
Queries with impressions but few clicks can become new blog topics.
Monitor SEO Growth
Track clicks and rankings after:
- Publishing new blogs
- Updating content
- Building backlinks
FAQs
The Performance Report in Google Search Console shows clicks, impressions, CTR, and keyword rankings of your website in Google Search results.
Open the Performance Report and go to the Queries tab to see keywords, clicks, impressions, CTR, and average ranking positions.
A good CTR depends on industry and ranking position, but improving titles and meta descriptions can increase CTR significantly.
This usually means your page appears in search results but users are not clicking. Improving SEO titles and meta descriptions can help.
Important Things to Remember
- Google Search Console data is not always 100% complete because Google hides some rare or sensitive queries for privacy reasons.
- Recent data may be delayed or preliminary.
- Search Console is best used for trend analysis rather than exact traffic measurement.
Pro Tips for Beginners
- Check Performance Report every week
- Focus more on clicks and impressions than average position
- Update pages with declining CTR
- Optimize pages ranking on Page 2
- Use query data to improve content strategy
Final Thoughts
The Performance Report in Google Search Console is one of the most powerful free SEO tools available today. It helps you understand how users find your website on Google and what improvements can increase your traffic.
If you regularly monitor clicks, impressions, CTR, and keyword rankings, you can make smarter SEO decisions and grow your organic traffic consistently.
For beginners in SEO and digital marketing, learning this report is a major step toward understanding real website performance.